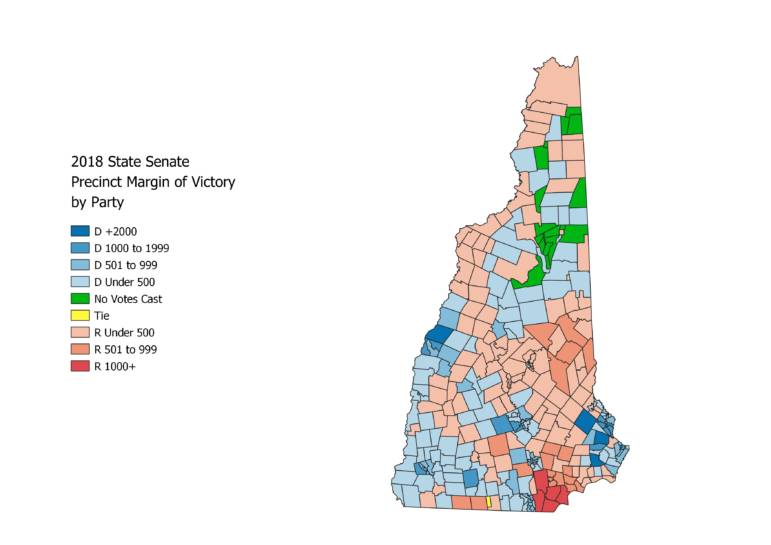
Election Day is now just hours away and it’s time to continue our series on what to look for when the vote tallies come in on Election Night with a look at the races for the New Hampshire State Senate. Here, the races are a little more straight forward than what one will find in the House, but for an analysis on those races, click here.

District 1 :Erin Hennessey (R – Littleton) vs. Susan Ford (D- Easton)
A pair of four-term state representatives will face off in the race for the North Country’s senate seat, with Hennessey defeating incumbent David Starr by a nearly two-to-one margin in the Republican Primary due in part to Governor Sununu’s endorsement.
When Starr defeated incumbent Democrat Jeff Woodburn in 2018, Woodburn did worse in 40 of 41 municipalities in the district, dropping nearly a thousand votes in Berlin from 2016, one of several places where he underperformed. Of course, he was arrested on domestic violence charges just months before Election Day, so that more than likely played a role in the outcome.
District 1 Precincts with Most Republican Votes in 2018
- Littleton: 1,244
- Berlin: 1,192
- Lancaster: 652
- Gorham: 530
- Bethlehem: 521
District 1 Precincts with Most Democratic Votes in 2018
- Berlin: 1,453
- Littleton: 839
- Bethlehem: 590
- Thornton: 582
- Gorham: 559

District 2: Bob Guida (R – Warren) vs. Bill Bolton (D – Plymouth)
Two-term incumbent Giuda is in a rerun against Bolton, chairman of the Plymouth Select Board. Last month, NHPR reported that Giuda was involved in an extra-marital affair caused by COVID-19 loneliness, with the woman involved in the affair attempting to extort him for money.
District 2 Precincts with Most Republican Votes in 2018
- Meredith: 1,753
- Haverhill: 968
- Sanbornton: 822
- Plymouth: 761
- Tilton: 721
District 2 Precincts with Most Democratic Votes in 2018
- Plymouth: 1,752
- Meredith: 1,402
- Campton: 837
- Sanbornton: 670
- Holderness: 667
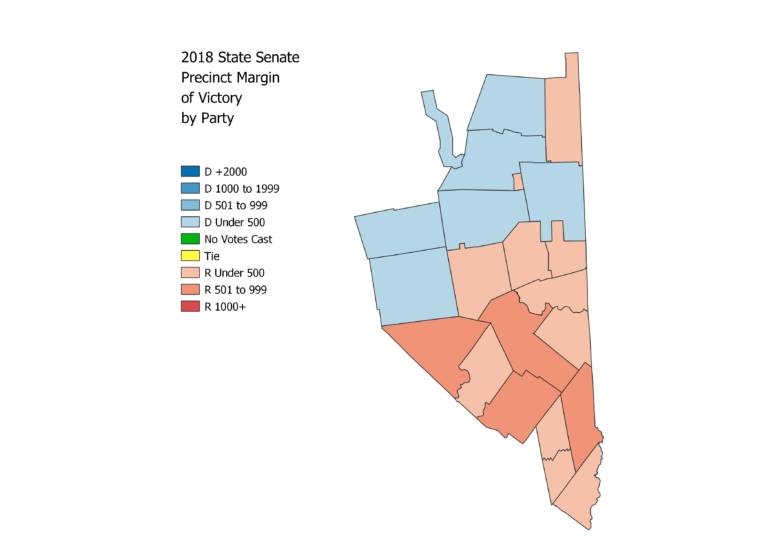
District 3: Jeb Bradley (R – Wolfeboro) vs. Teresa Swanick (D – Effingham)
District 3 is roughly congruous with Carroll County, which as we saw in the House analysis is Democratic in the north and Republican in the south. However, given Bradley’s name recognition from over 30 years in Concord and Washington, this could be one of the safest Republican seats in the senate. Swanick served on the Planning Board and Zoning Board of Appeals in Effingham.
District 3 Precincts with Most Republican Votes in 2018
- Wolfeboro: 2,206
- Conway: 1,827
- Moultonborough: 1,657
- Wakefield: 1,325
- Ossipee: 1,070
District 3 Precincts with Most Democratic Votes in 2018
- Conway: 2,058
- Wolfeboro: 1,380
- Moultonborough: 893
- Bartlett: 869
- Wakefield: 643

District 4: David Watters (D – Dover) vs. Frank Bertone (R – Barrington)
Watters didn’t face an opponent in 2018. His opponent this year is running against a “satanic agenda.”
District 4 Precincts with Most Democratic Votes in 2018
- Barrington: 2,516
- Dover Ward 3: 1,899
- Dover Ward 4: 1,741
- Dover Ward 1: 1,720
- Dover Ward 2: 1,715

District 5: Suzanne Prentiss (D-Lebanon) vs. Timothy O’Hearne (R-Charlestown)
The real race here was in the Democratic Party to replace outgoing incumbent Martha Hennessey. Prentiss, Executive Director of the American Trauma Society and former mayor of Lebanon took the day there in a recount against Dartmouth professor Beatriz Pastor. Let’s just say that Trump would have to be winning New Hampshire by ungodly margins and share that down ballot to make this race anywhere near close.
District 5 Precincts with Most Democratic Votes in 2018
- Hanover: 5,200
- Lebanon Ward 1: 1,535
- Lebanon Ward 3; 1,521
- Lebanon Ward 2: 1,398
- Plainfield: 856
District 5 Precincts with Most Republican Votes in 2018
- Hanover: 785
- Charlestown: 778
- Claremont Ward 2: 694
- Enfield: 661
- Claremont Ward 3: 613
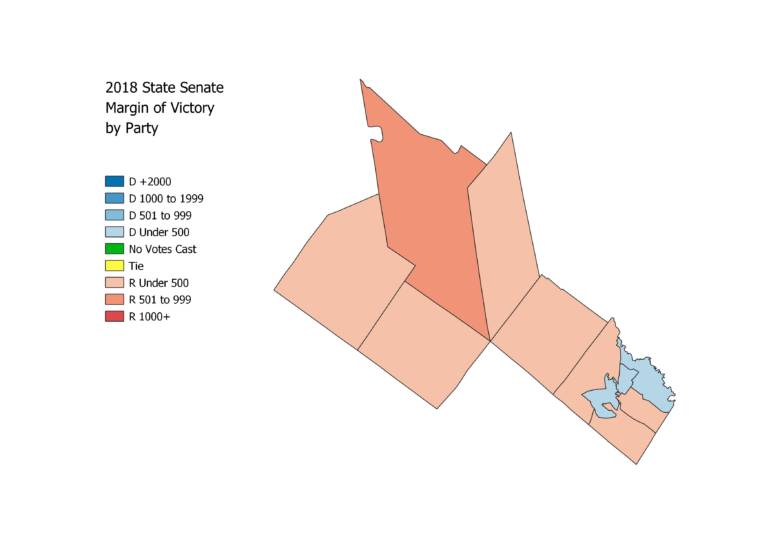
District 6: James Gray (R – Rochester) vs. Christopher Rice (D – Rochester)
This is a race between two incumbent Rochester city councilors in a district consisting of Rochester and a few towns north of Rochester favorable to Republicans. It’s not quite as safe as Jeb Bradley’s seat, but it’s a tough nut to crack for Democrats, they would need to keep things close in the towns outside of Rochester for any chance of ousting the incumbent Gray.
District 6 Precincts with Most Republican Votes in 2018
- Alton: 1,735
- Farmington: 1,251
- Barnstead: 1,139
- Rochester Ward 2: 1,098
- Rochester Ward 1: 1,034
District 6 Precincts with Most Democratic Votes in 2018
- Rochester Ward 1: 1,055
- Rochester Ward 2: 986
- Farmington: 942
- Rochester Ward 4: 939
- Rochester Ward 3: 931
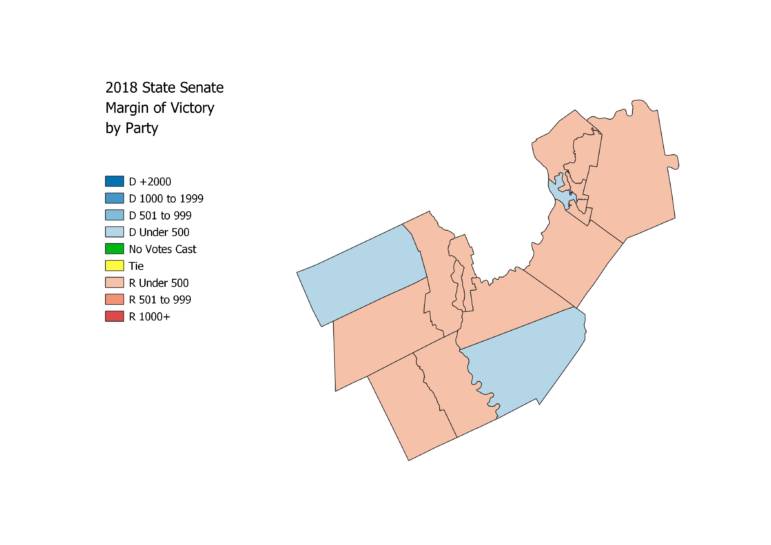
District 7: Harold French (R – Webster) vs. Phillip Spagnuolo (D – Laconia)
This is another hard nut to crack for Democrats, deep in the heart of one of the Republicans’ strongest parts of the state. If 2018 serves as any indication, Spagnuolo, a sober home operator and state representative, will need to somehow find an extra thousand combined votes in Laconia and Franklin to have a shot.
District 7 Precincts with Most Republican Votes in 2018
- Gilford: 1,935
- Belmont: 1,561
- Northfield: 930
- Laconia Ward 6: 782
- Laconia Ward 1: 697
District 7 Precincts with Most Democratic Votes in 2018
- Gilford: 1,669
- Belmont: 1,069
- Canterbury: 777
- Northfield: 735
- Boscawen: 603
District 8: Ruth Ward (R – Stoddard) vs. Jenn Alford-Teaster (D – Bradford)
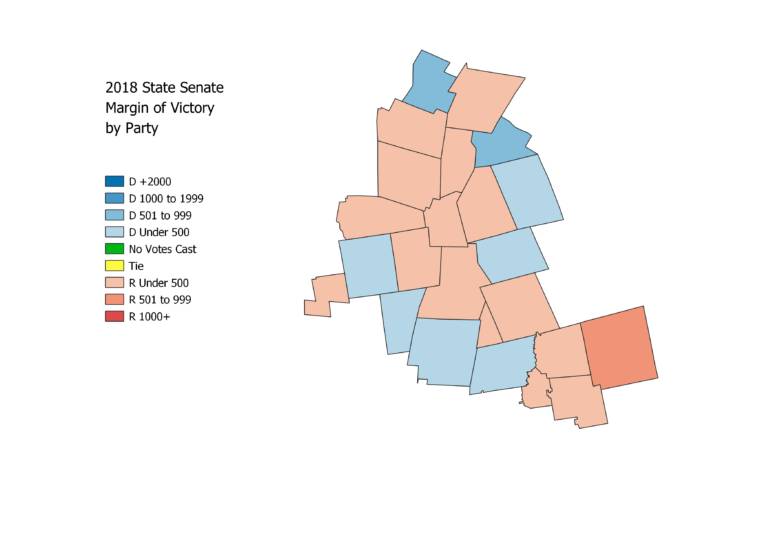
This fairly rural district at the intersection of Hillsborough, Sullivan and Merrimack Counties is probably the best chance Democrats have for a pickup this cycle, these two candidates came within 647 votes in 2018.
District 8 Precincts with Most Republican Votes in 2018
- Weare: 2,122
- Hillsborough: 1,197
- Newport: 1,161
- New London: 1,018
- Sunapee: 972
District 8 Precincts with Most Democratic Votes in 2018
- New London: 1,522
- Weare: 1,457
- Grantham: 1,181
- Hillsborough: 1,037
- Newport: 864
District 9: Jeanne Dietsch (D – Peterborough) vs. Denise Ricciardi (R – Bedford)
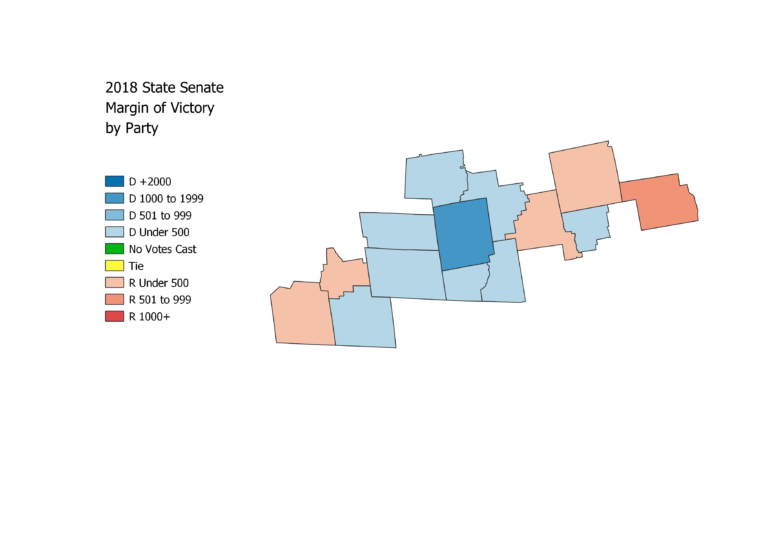
This district is favorable geographically for Democrats, with Bedford’s strong Republican foundation not tied with any other precincts that are nearly as Republican. Dietsch lost Bedford by around 600, but she took 10 of the other 13 towns in the district and lost Troy by just one vote.
Again, the story here for Republicans will be run up the score for in Bedford and hold close elsewhere and vice versa for Democrats.
District 9 Precincts with Most Democratic Votes in 2018
- Bedford: 4,978
- Peterborough: 2,319
- New Boston: 1,275
- Jaffrey: 1,144
- Mont Vernon: 702
District 9 Precincts with Most Republican Votes in 2018
- Bedford: 5,525
- New Boston: 1,528
- Jaffrey: 1,042
- Peterborough: 1,021
- Mont Vernon: 604
District 10: Jay Kahn (D – Keene) vs. Daniel LeClair (R – Swanzey)
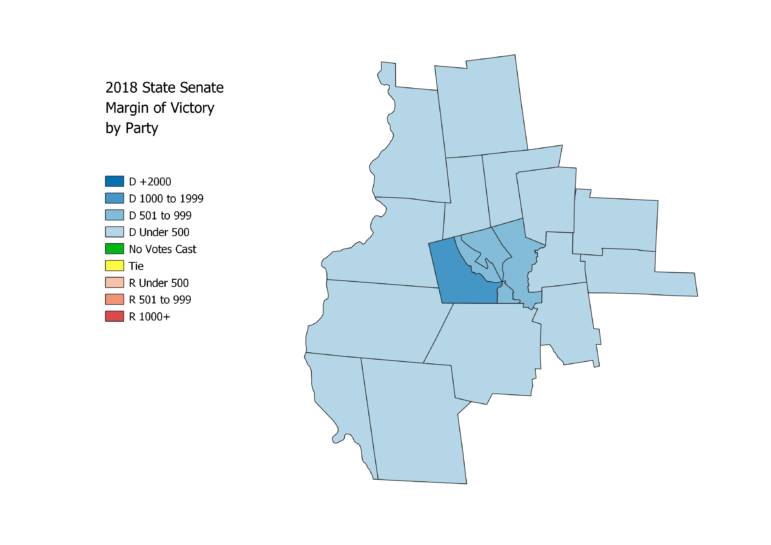
Kahn more than doubled the tally of LeClair in 2018 and its unclear how that can change this time around given that this district is primarily located in one of the strongest parts of the state for Democrats.
District 10 Precincts with Most Democratic Votes in 2018
- Keene Ward 5: 1,641
- Swanzey: 1,564
- Keene Ward 2: 1,427
- Keene Ward 4: 1,426
- Keene Ward 3: 1,296
District 10 Precincts with Most Republican Votes in 2018
- Swanzey: 1,233
- Chesterfield: 698
- Walpole: 607
- Keene Ward 5: 576
- Keene Ward 4: 551
District 11: Shannon Chandley (D – Amherst) vs. Gary Daniels (R – Milford)
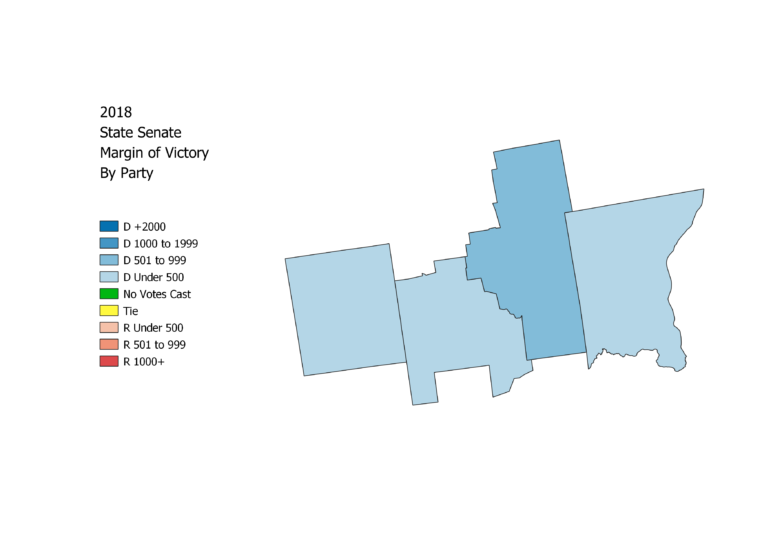
This clash between two Concord veterans is perhaps most emblematic of New Hampshire’s slow change into a reliably Democratic state at the national level. As recently as a few years ago, this would have been a safe Republican seat. Today, it can go either way and it will be key to whichever party holds control of the Senate, with Chandley narrowly beating Daniels by slightly over a thousand votes in 2018.
This is also the most compact district so far on the list, with only four precincts.
District 11 Precincts with Most Democratic Votes in 2018
- Merrimack: 5,685
- Amherst: 3,506
- Milford: 2,317
- Wilton: 953
District 11 Precincts with Most Republican Votes in 2018
- Merrimack: 5,598
- Milford: 3,076
- Amherst: 2,703
- Wilton: 828

District 12: Melanie Levesque (D – Brookline) vs. Kevin Avard (R – Nashua)
This is another close race between two established contenders. Levesque has earned national attention in the past and took the seat away from Avard in 2018. Her history in Holls and Brookline, two towns that are slightly easier for Republicans, could be the deciding factor here.
District 12 Precincts with Most Democratic Votes in 2018
- Nashua Ward 1: 2,400
- Nashua Ward 5: 2,286
- Hollis: 2,229
- Nashua Ward 2: 2,014
- Brookline: 1,336
District 12 Precincts with Most Republican Votes in 2018
- Hollis: 2,009
- Nashua Ward 1: 2,003
- Nashua Ward 5: 1,923
- Rindge: 1,514
- New Ipswich: 1,496

District 13: Cindy Rosenwald (D – Nashua) vs. Mariellen MacKay (R – Nashua)
While District 12 has the more suburban parts of Nashua, District 13 has its urban core and is a fairly safe seat for Democrats.
District 13 Precincts with Most Democratic Votes in 2018
- Nashua Ward 8: 2,278
- Nashua Ward 9: 2,253
- Nashua Ward 3: 2,075
- Nashua Ward 6: 1,715
- Nashua Ward 7: 1,625
District 13 Precincts with Most Republican Votes in 2018
- Nashua Ward 9: 1,583
- Nashua Ward 8: 1,417
- Nashua Ward 3: 1,295
- Nashua Ward 7: 1,162
- Nashua Ward 6: 1,113

District 14: Sharon Carson (R – Londonderry) vs. Nancy Hendricks (D- Londonderry)
District 14 has three towns and all three are heavily Republican. It’s hard to imagine a scenario where Sharon Carson is not re-elected…here at Manchester Ink Link we’d like to think that it involves a volcano of some sort appearing at Mack’s Apple Farm, but that’s mainly because we’re brainstorming ideas for NaNoWriMo.
District 14 Precincts with Most Republican Votes in 2018
- Londonderry: 5,775
- Hudson: 5,295
- Auburn: 1,753
District 14 Precincts with Most Democratic Votes in 2018
- Londonderry: 4,679
- Hudson: 3,756
- Auburn: 989

District 15: Becky Whitley (D – Hopkinton) vs. Linda Rae Banfill (R – Concord)
Three challengers, including former Congressman Paul Hodes, sought the Democratic nomination for this seat and attorney Becky Whitley took the prize. Like District 5, the Democratic Primary was the real race in this district, with now Democratic Gubernatorial Nominee Dan Feltes repeatedly drubbing his opponents during his three previous wins in this district.
District 15 Precincts with Most Democratic Votes in 2018
- Hopkinton: 2,162
- Concord Ward 7: 1,607
- Concord Ward 5: 1,604
- Concord Ward 10: 1,471
- Concord Ward 4: 1,213
District 15 Precincts with Most Republican Votes in 2018
- Hopkinton: 1,137
- Concord Ward 10: 940
- Henniker: 755
- Concord Ward 1: 647
- Concord Ward 8: 644
District 16: Kevin Cavanaugh (D – Manchester) vs. Jason Syversen (R – Dunbarton)
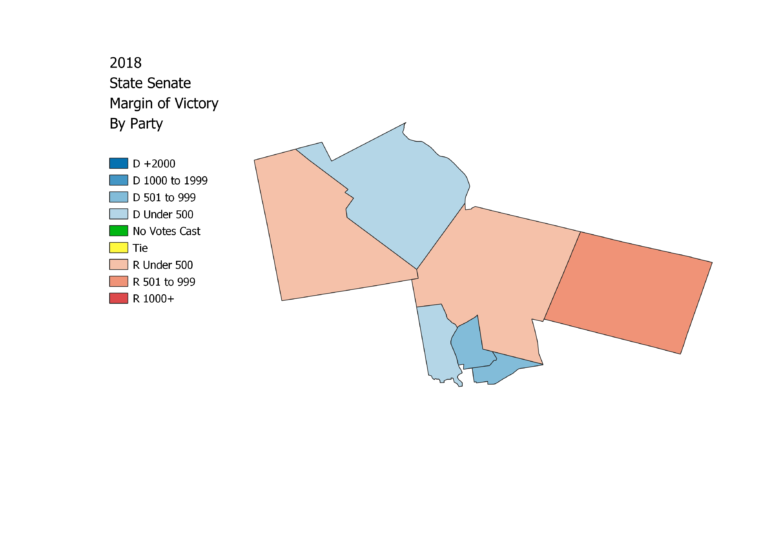
Cavanaugh won this seven-precinct district by around 1,110 votes in 2018, an amount that is not a decisive win for an average New Hampshire State Senate District.
Luckily for Cavanaugh, he has two of the most Democratic wards in Manchester in his district as well as Bow, which at state elections has become a sort of bleed-over from Concord, which is a Democratic fortress. Syversen will need to dominate in Hooksett for any chance of victory.
District 16 Precincts with Most Democratic Votes in 2018
- Hooksett: 2,731
- Manchester Ward 1: 2,594
- Bow: 2,322
- Manchester Ward 2: 2,202
- Manchester Ward 12: 1,838
District 16 Precincts with Most Republican Votes in 2018
- Hooksett: 3,110
- Bow: 1,857
- Manchester Ward 1: 1,789
- Manchester Ward 2: 1,515
- Manchester Ward 12: 1,446

District 17: John Reagan (R – Deerfield) vs. Nancy Fraher (D – Chichester)
Before anyone asks, we do not know of any connection between incumbent John Reagan and former President Ronald Reagan. If anyone does, let us know! Ultimately, it’s hard to be a Republican with that last name and not be overshadowed a little bit.
Regardless of his relatives, he won comfortably in 2018 in this district nestled right in between the two heartlands of New Hampshire Republican support.
Fraher is the chair of the Chichester School Board and the SAU53 School Board.
District 17 Precincts with Most Republican Votes in 2018
- Raymond: 2,220
- Loudon: 1,488
- Pembroke: 1,412
- Deerfield: 1,245
- Nottingham: 1,227
District 17 Precincts with Most Democratic Votes in 2018
- Raymond: 1,559
- Pembroke: 1,444
- Nottingham: 1,185
- Loudon: 997
- Deerfield: 974
District 18: Donna Soucy (D – Manchester) vs. George Lambert (R – Litchfield)
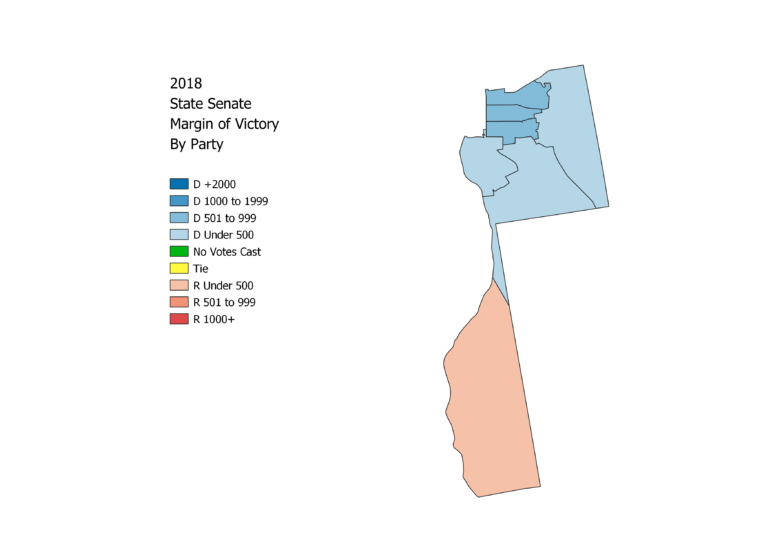
Lambert narrowly beat out Manchester Alderman Ross Terrio for a rematch with the Senate President. Soucy won by just over 2,000 votes in 2018 and all of the Manchester-based precincts, losing by 160 votes in Litchfield.
Litchfield is the bellwether here, Lambert will have to have a much larger margin of victory there and hold things close in Manchester, but he faces a tough climb.
District 18 Precincts with Most Democratic Votes in 2018
- Manchester Ward 6: 2,122
- Manchester Ward 8: 2,027
- Manchester Ward 9: 1,719
- Litchfield: 1,686
- Manchester Ward 7: 1,575
District 18 Precincts with Most Republican Votes in 2018
- Litchfield: 1,846
- Manchester Ward 8: 1,696
- Manchester Ward 6: 1,626
- Manchester Ward 9: 1,235
- Manchester Ward 7: 1,038
District 19: Regina Birdsell (R – Hampstead) vs. Joshua Bourdon (D – Derry)
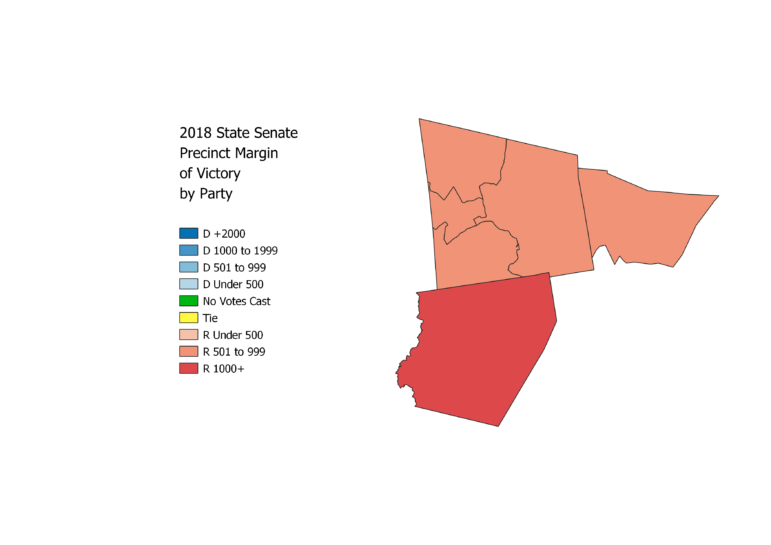
District 19 is an almost identical twin to the neighboring District 14: three very traditionally Republican towns. Derry makes up around two-thirds of the district and this is a safe Republican seat unless Derry has transitioned from a part of the Republican heartland in western Rockingham County into a true battleground.
District 19 Precincts with Most Republican Votes in 2018
- Derry: 5,907
- Windham: 3,805
- Hampstead: 2,480
District 19 Precincts with Most Democratic Votes in 2018
- Derry: 5,057
- Windham: 2,649
- Hampstead: 1,563

District 20: Lou D’Allesandro (D – Manchester) vs. Carla Gericke (R – Manchester)
This five-precinct district, which includes Goffstown and most of Manchester’s downtown and West Side, is a rematch from 2018 that D’Allesandro, well known as the “Lion of the New Hampshire Senate” won by around 2,900 votes.
Gericke has been a critic of government intervention regarding the COVID-19 pandemic and also has strong ties with libertarians in the state, running as a fusion Libertarian/Republican candidate in 2018.
District 20 Precincts with Most Democratic Votes in 2018
- Goffstown: 3,803
- Manchester Ward 10: 1,764
- Manchester Ward 3: 1,567
- Manchester Ward 4: 1,440
- Manchester Ward 11: 1,329
District 20 Precincts with Most Republican Votes in 2018
- Goffstown: 3,265
- Manchester Ward 10: 1,211
- Manchester Ward 11: 963
- Manchester Ward 4: 878
- Manchester Ward 3: 730

District 21: Rebecca Kwoka (D – Portsmouth) vs. Sue Polidura (R – Portsmouth)
With Martha Fuller Clark stepping aside after nearly 30 years in Concord in some form, and Kwoka easily defeated Portsmouth City Councillor Douglas MacEachern to win the chance to succeed Clark.
Beside District 4, which didn’t have any Republican candidate, this was the bluest state senate district in 2018, with Fuller Clark winning by more than a 2-to-1 margin. For a Republican to win here, that volcano in Londonderry for our upcoming novel would probably have to spew its lava all the way to the seacoast. Hey, that’s not a bad Chapter 2.
District 21 Precincts with Most Democratic Votes in 2018
- Durham: 5,070
- Newmarket: 2,940
- Portsmouth Ward 2: 2,096
- Portsmouth Ward 5: 1,664
- Portsmouth Ward 1: 1,579
District 21 Precincts with Most Republican Votes in 2018
- Newmarket: 1,426
- Durham: 1,277
- Portsmouth Ward 1: 645
- Portsmouth Ward 3: 635
- Portsmouth Ward 4: 635
District 22: Chuck Morse (R – Salem) vs. Thomas Haynes (D – Salem)
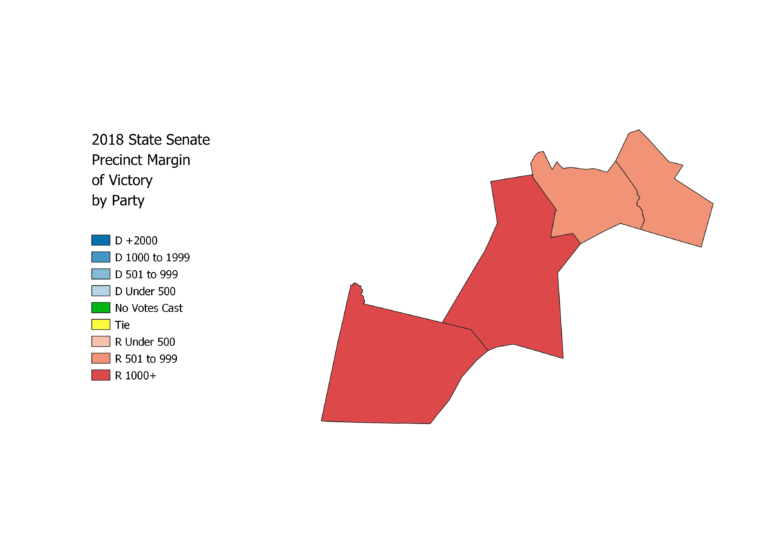
Morse won this district by more than any other Republican in 2018 and it’s another clone of District 14 and 19, only with four towns smack in the heart of Republican-topia instead of three. For the Democrats to pick up this seat, we go to Chapter 3 of this developing novel where we discover that the volcano was triggered by a magical emerald that had been buried under the former site of the Rockingham Park race track.
District 22 Precincts with Most Republican Votes in 2018
- Salem: 6,376
- Pelham: 3,277
- Atkinson: 2,173
- Plaistow: 1,745
District 22 Precincts with Most Democratic Votes in 2018
- Salem: 4,672
- Pelham: 2,024
- Atkinson: 1,244
- Plaistow: 1,215

District 23: Jon Morgan (D – Brentwood) vs. Bill Gannon (R – Sandown)
In the New Hampshire Senate, 21+22=23. This district is something of a synthesis between the Portsmouth-based District 21 and the Salem-based District 22 and it showed in 2018 with the narrowest margin of victory for either party, with Morgan defeating Gannon by just 105 votes.
The road to victory for Morgan runs through Exeter, the largest town in the district, which he took by a nearly 2-to-1 margin in 2018.
District 23 Precincts with Most Democratic Votes in 2018
- Exeter: 4,977
- Kingston: 1,221
- Epping: 1,488
- Brentwood: 1,071
- Sandown: 1,069
District 23 Precincts with the Most Republican Votes in 2018
- Exeter: 2,692
- Sandown: 1,589
- Epping: 1,578
- Kingston: 1,550
- Chester: 1,389

District 24: Tom Sherman (D – Rye) vs. Regina Barnes (R- Hampton)
And last, but not least, we have the State Senate district that represents the smallest coastline in the U.S.
Sherman defeated long-time state representative Dann Innis by a comfortable but not exorbitant margin in 2018, winning most of the big towns in the district.
District 24 Precincts with Most Democratic Votes in 2018
- Hampton: 4,476
- Stratham: 2,346
- Rye: 2,128
- North Hampton: 1,424
- Seabrook: 1,294
District 24 Precincts with Most Republican Votes in 2018
- Hampton: 3,762
- Stratham: 1,850
- Seabrook: 1,750
- Rye: 1,392
- North Hampton: 1,172
